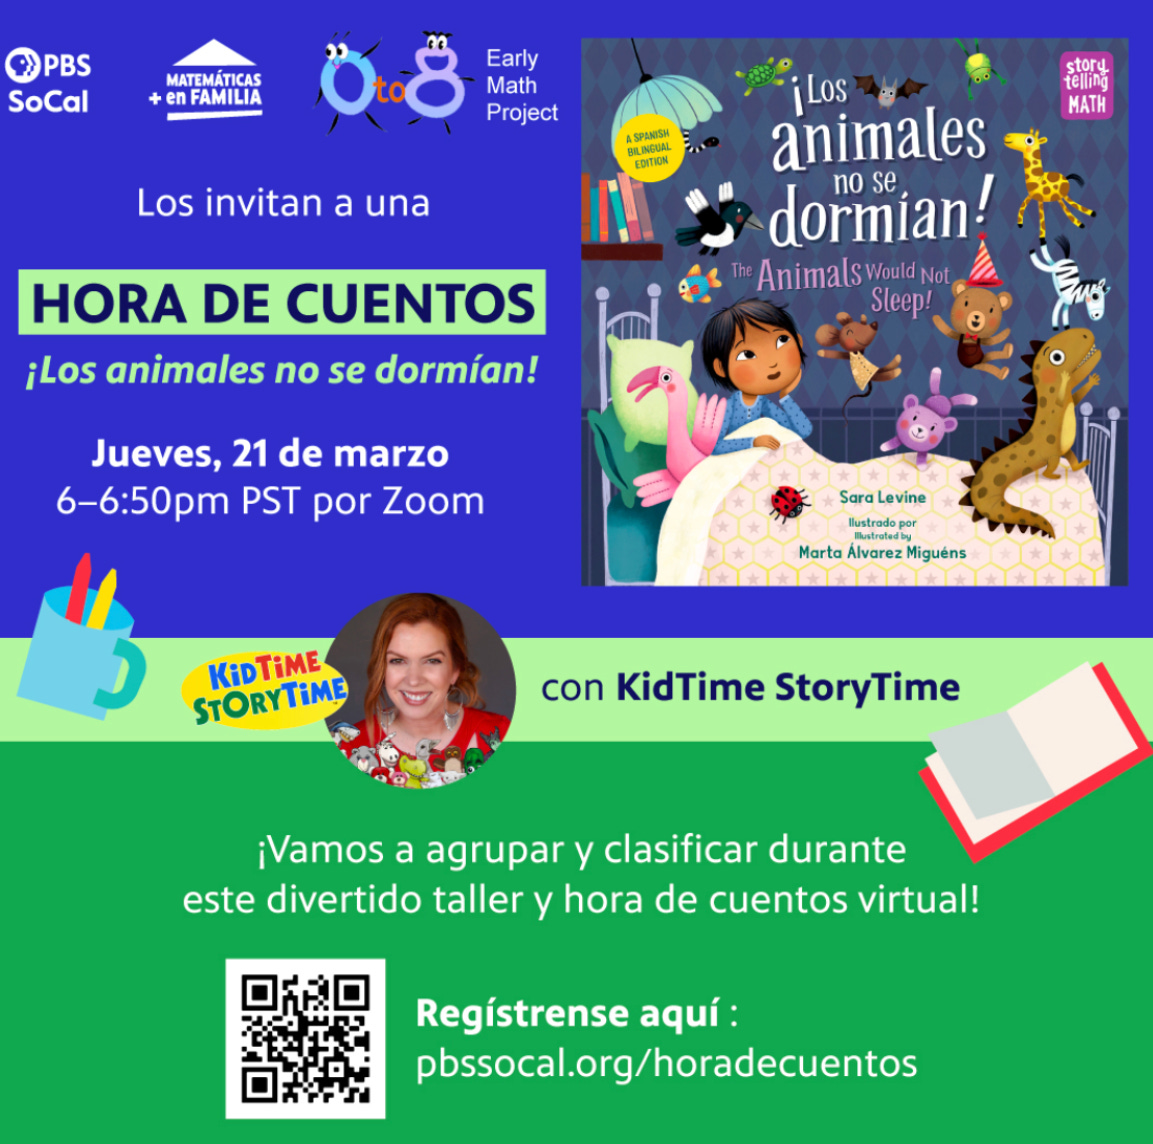
Family Interactive Workshop
The Early Math Project and PBS SoCal invite you to a free interactive workshop featuring a read aloud and interactive activities for the book, The Animals Would Not Sleep! / ¡Los animales no se dormían! The workshops are intended for families with children from age 2 to 8.
Join us for one or both of these free virtual workshops.
The Animals Would Not Sleep! (In English)
Practice sorting and classifying in this fun, virtual read-aloud and workshop!
Thursday, March 21, 2024
5 - 6pm PST
Register here for the English workshop - pbssocal.org/storytime
¡Los animales no se dormían! (En Español)
¡Practiquen agrupar y clasificar en esta hora de cuentos y taller virtual!
Jueves, 21 de marzo, 2024
6 - 7pm PST
Regístrense aqui para la taller Español - pbssocal.org/horadecuentos
2024 Mathical Book Prize Award Winners
The Simons Laufer Mathematical Sciences Institute announced the 2024 Mathical Book Prize Winners on February 21, 2024.
2024 Award Winners
Pre-K
Kitty & Cat: Bent Out of Shape, written and illustrated by Mirka Hokkanen (Candlewick Press).
Grades K-2
Friends Beyond Measure: A Story Told with Infographics, written and illustrated by Lalena Fisher (HarperCollins).
Grades 3-5
Friend of Numbers: The Life of Mathematician Srinivasa Ramanujan by Priya Narayanan, with illustrations by Satwik Gade (Eerdmans Publishing/Eerdmans Books for Young Readers).
Grades 6-8
Talia’s Codebook for Mathletes, written and illustrated by Marissa Moss (Candlewick Press).
Grades 9-12
A Quantum Life (Adapted for Young Adults): My Unlikely Journey from the Streets to the Stars by Hakeem Oluseyi and Joshua Horwitz (Random House Children’s Books)
Nineteen Honor Books were also selected - you can find out more about the award and honor books here.
The Early Math Project created book guides and activities for the Pre-K, Grades K-2, and Grades 3-5 Award Winners. They can be found at the links below:
Book Guide for Kitty and Cat: Bent Out of Shape
Book Guide for Friends Beyond Measure: A Story Told with Infographics
Book Guide for Friend of Numbers: The Life of Mathematician Srinivasa Ramanujan
What’s an Infographic?
Infographics are visual images like charts, maps, graphs, and diagrams that help people organize and analyze data, make comparisons, spot trends, share information, make decisions, and reach conclusions. When children create infographics, they often engage in:
sorting
classifying
comparing
counting
organizing
problem-solving
analyzing
It’s important for children to have experiences creating and interpreting different types of infographics as they are a common way of sharing information. Look for infographics with your child and talk about what they mean together.
Two infographics books to explore with children are:
Stuart J. Murphy’s Show and Tell! Great Graphs and Smart Charts: An Introduction to Infographics. Find the Early Math Project’s Resources for Show and Tell! here.
Lalena Fisher’s Friends Beyond Measure: A Story Told with Infographics. Find the Early Math Project’s Resources for Friends Beyond Measure here.
During the 2023 Early Math Symposium Jon Dueck, a STEM leader with the California Early Math Initiative, and children’s author Stuart J. Murphy talked about how children can organize information about their own lives and the things that interest them. In their presentation Great Graphs and Smart Charts: Pre-K to Grade 3, Jon and Stuart showcased the attributes of four basic types of graphs: Bar Graphs, Pictographs, Pie Charts, and Line Graphs and how to create them. There presentation can be found here.


